Table of Contents
Write something….
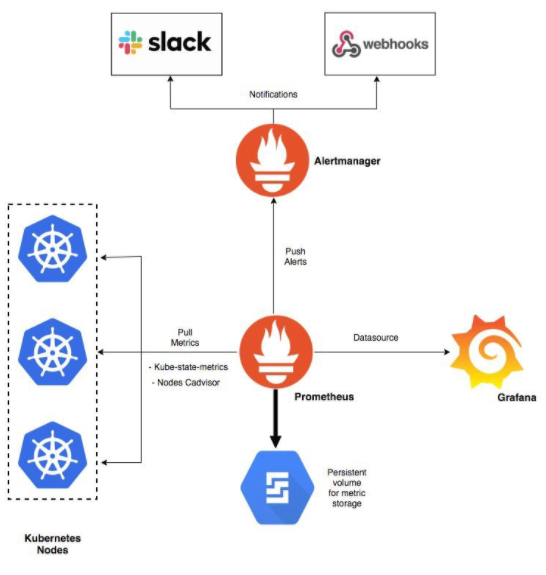
Components of the Solution:
The `kube-prometheus-stack` Helm chart is designed to deploy a comprehensive set of Kubernetes-native monitoring and alerting tools, primarily based on Prometheus and Grafana. Here are some of the core components that were commonly included:
Prometheus Operator
The Prometheus Operator is a set of Kubernetes custom resources and controllers that simplifies the deployment, configuration, and management of Prometheus and related components in a Kubernetes cluster. It leverages the declarative nature of Kubernetes to define monitoring resources, making it easier to manage Prometheus instances, alerting rules, and related components. Here’s an overview of the key components in the Prometheus Operator:
Prometheus Custom Resource (CR):
The central component managed by the Prometheus Operator is the Prometheus custom resource. It defines the desired state of a Prometheus monitoring instance, including details such as scrape targets, alerting rules, and storage configurations.
“`yaml
apiVersion: monitoring.coreos.com/v1
kind: Prometheus
metadata:
name: example-prometheus
spec:
replicas: 2
serviceMonitorSelector:
matchLabels:
team: frontend
…
“`
ServiceMonitors:
ServiceMonitors are custom resources that specify how Prometheus should discover and monitor services within the Kubernetes cluster. They define labels to match services to be monitored and configuration details like scrape intervals.
“`yaml
apiVersion: monitoring.coreos.com/v1
kind: ServiceMonitor
metadata:
name: example-app
labels:
team: frontend
spec:
selector:
matchLabels:
app: example-app
endpoints:
port: web
“`
AlertManager Custom Resource:
In addition to Prometheus, the Prometheus Operator manages Alertmanager instances. The AlertManager custom resource allows you to define the desired state of AlertManager instances.
“`yaml
apiVersion: monitoring.coreos.com/v1
kind: Alertmanager
metadata:
name: example-alertmanager
spec:
replicas: 3
…
“`
Prometheus Rule Custom Resource:
The Prometheus Rule custom resource is used to define recording and alerting rules in a declarative manner. This allows you to manage alerting and recording rules alongside the Prometheus instance they belong to.
“`yaml
apiVersion: monitoring.coreos.com/v1
kind: PrometheusRule
metadata:
name: example-rules
spec:
groups:
name: example.rules
rules:
alert: HighErrorRate
expr: job:errors_per_second:rate1m > 1
“`
Service Discovery:
The Prometheus Operator simplifies service discovery by leveraging Kubernetes labels and annotations. It automatically discovers and scrapes services that match the specified labels in ServiceMonitors.
Grafana Integration:
While not part of the Prometheus Operator itself, it is common to integrate Grafana for visualization and dashboarding. The Prometheus Operator often includes configurations for Grafana, making it easier to set up dashboards that pull data from Prometheus.
“`yaml
apiVersion: monitoring.coreos.com/v1
kind: Grafana
metadata:
name: example-grafana
spec:
…
“`
RBAC and Security Settings:
The Prometheus Operator includes Role-Based Access Control (RBAC) configurations and security settings to ensure secure access and permissions within the Kubernetes cluster.
“`yaml
apiVersion: monitoring.coreos.com/v1
kind: Prometheus
metadata:
name: example-prometheus
spec:
serviceAccountName: prometheus
…
“`
The Prometheus Operator simplifies the process of managing Prometheus and related components in a Kubernetes environment, promoting best practices for monitoring within the Kubernetes ecosystem. It abstracts away many of the complexities associated with manual Prometheus configuration, making it easier to set up and maintain a robust monitoring infrastructure.
Prometheus
Prometheus is an open-source monitoring and alerting toolkit designed for reliability and scalability. It collects and stores time-series data, allowing users to query, visualize, and alert on the metrics generated by their systems. Here’s an overview of the key components in Prometheus:
Prometheus Server:
The Prometheus server is the core component responsible for collecting, processing, and storing time-series data. It regularly scrapes metrics from configured targets (such as applications, services, or infrastructure components) using the Pull model.
Prometheus Configuration:
The configuration file for Prometheus defines various aspects of its behavior, including scrape targets, alerting rules, and storage configurations. It uses a simple YAML syntax to specify these settings.
“`yaml
global:
scrape_interval: 15s
scrape_configs:
job_name: ‘example-job’
static_configs:
targets: [‘example-service:9090’]
“`
PromQL (Prometheus Query Language):
PromQL is a powerful query language used to retrieve and manipulate time-series data stored in Prometheus. It allows users to perform complex queries, aggregations, and transformations on the collected metrics.
“`promql
sum(rate(http_requests_total{job=”example-job”}[5m])) by (status)
“`
Scrape Targets:
Scrape targets are the entities (services, applications, or endpoints) from which Prometheus collects metrics. Each target is defined in the configuration file and includes information such as the target’s address and additional labels.
“`yaml
job_name: ‘example-job’
static_configs:
targets: [‘example-service:9090’]
“`
Time-Series Database:
Prometheus stores time-series data in its local time-series database. The data is organized by metric name and a set of key-value pairs known as labels. The storage engine allows efficient querying and retrieval of historical metrics.
Alerting Rules:
Alerting rules define conditions under which alerts should be triggered. These rules are specified in the Prometheus configuration file and are evaluated continuously. When a rule evaluates to true, an alert is generated.
“`yaml
groups:
name: example-rules
rules:
alert: HighErrorRate
expr: job:errors_per_second:rate1m > 1
“`
Alertmanager Integration:
Prometheus integrates with the Alertmanager component to manage and send alerts. When an alert is fired, it is sent to Alertmanager, which takes care of grouping, deduplication, and routing alerts to different receivers (such as email, Slack, or other notification channels).
Web UI and Expression Browser:
Prometheus provides a simple web-based user interface that allows users to explore and visualize metrics. It includes an Expression Browser for testing and refining PromQL queries.
Exporters:
Exporters are third-party tools or agents that expose metrics from various systems in a format Prometheus can understand. They act as bridges between Prometheus and applications or services that do not natively expose metrics.
Grafana Integration:
While Grafana is a separate tool, it is often used in conjunction with Prometheus for data visualization and dashboarding. Grafana connects to Prometheus as a data source, allowing users to create rich, customizable dashboards.
“`yaml
apiVersion: 1
datasource:
name: Prometheus
type: prometheus
url: http://prometheus-server:9090
“`
These components together form a comprehensive monitoring solution that enables users to gain insights into the performance and health of their systems. Prometheus’s architecture is designed to be modular, flexible, and scalable, making it a popular choice for monitoring in dynamic and cloud-native environments.
Grafana
Grafana is an open-source platform for monitoring and observability that provides a flexible and feature-rich environment for creating, sharing, and exploring interactive dashboards. It supports various data sources, including Prometheus, Graphite, Elasticsearch, and many others. Below is an overview of the key components in Grafana:
Dashboard:
A dashboard is a customizable and interactive web page within Grafana where users can arrange panels to display visualizations of their data. Dashboards are composed of panels, which can include charts, graphs, tables, and other visualization types.
Panel:
A panel is a single visualization or metric display within a dashboard. Panels can represent different types of data, such as time-series charts, single stat values, logs, or tables. Each panel is configured to query a specific data source and present the information in a chosen format.
Data Source:
A data source is a backend system or database that provides the data for Grafana dashboards. Grafana supports a variety of data sources, including Prometheus, Graphite, InfluxDB, Elasticsearch, and more. Users configure data sources to connect Grafana to their underlying data storage systems.
“`yaml
apiVersion: 1
datasource:
name: Prometheus
type: prometheus
url: http://prometheus-server:9090
“`
Query Editor:
The Query Editor is a Grafana feature that allows users to interactively build queries for data retrieval from the configured data source. It provides a user-friendly interface for selecting metrics, specifying filters, and refining queries.
Annotations:
Annotations are markers on a graph or panel that provide additional context to the data. Users can add annotations manually or configure automatic annotations based on events or thresholds in the data.
Alerting: (We are not using this alert stream currently!)
Grafana includes an alerting system that allows users to define alert conditions based on the data from their panels. When these conditions are met, alerts can trigger notifications (such as emails or Slack messages) or change the state of the dashboard.
“`yaml
alert:
conditions:
– type: query
query: A > 10
reducer: avg
evaluator: gt
timeRange: …
…
“`
Templating:
Templating enables users to create dynamic and reusable dashboards by replacing variables with values specified at runtime. This is useful for creating generic dashboards that can be adapted to different environments or scenarios.
“`yaml
name: “datacenter”
label: “Datacenter”
type: “query”
datasource: <datasource>
query: “label_values(node, datacenter)”
“`
Grafana Plugins:
Grafana supports a plugin architecture that allows users to extend its functionality. Plugins can provide additional data sources, panel types, or features. There are numerous community-contributed plugins and official plugins maintained by Grafana Labs.
User Authentication and Authorization:
Grafana provides user authentication and authorization mechanisms to control access to dashboards and features. Users can log in with various authentication methods, and access permissions can be managed through organizations, teams, and roles.
Organizations and Users:
Grafana organizes users into organizations, each of which can have multiple users, teams, and associated dashboards. This organizational structure helps manage access control and permissions within Grafana.
Grafana API:
Grafana exposes a RESTful API that allows users to programmatically interact with and manage Grafana resources. This includes creating and updating dashboards, managing data sources, and performing other administrative tasks.
These components collectively make Grafana a powerful and versatile tool for monitoring and visualization, providing users with the ability to create insightful dashboards and gain valuable insights into their data.
Alertmanager:
The Alertmanager is a component in the Prometheus ecosystem responsible for handling alerts generated by Prometheus server. It takes care of deduplication, grouping, and routing alerts to different receivers based on configurations. Here’s an overview of the base configuration for Alertmanager used with Prometheus:
Alertmanager Configuration File:
The configuration for the Alertmanager is typically specified in a YAML configuration file. This file defines various settings, including global configurations, notification receivers, and route configurations.
“`yaml
global:
resolve_timeout: 5m
route:
receiver: team-notifications
“`
The `global` section includes settings applicable to the entire Alertmanager instance, such as the `resolve_timeout` (the maximum time to wait for an alert to resolve).
The `route` section defines the default route for alerts. In this example, alerts are sent to the receiver named `team-notifications`.
Receivers:
Receivers define where and how alerts should be sent. Common types of receivers include email, Slack, PagerDuty, or custom integrations. Each receiver is defined with specific configurations for the chosen notification channel.
“`yaml
receivers:
– name: team-notifications
email_configs:
– to: team@example.com
“`
In this example, a receiver named `team-notifications` is configured to send email notifications to the specified email address.
Inhibition Rules:
Inhibition rules are used to suppress or silence specific alerts based on the presence of others. This helps prevent redundant notifications when multiple alerts are related to the same issue.
“`yaml
inhibit_rules:
– source_match:
severity: ‘critical’
target_match:
severity: ‘warning’
equal: [‘alertname’, ‘dev’]
“`
In this example, an inhibition rule is defined to suppress critical alerts if there are corresponding warning alerts with the same `alertname` and `dev` label values.
Silences:
– Silences allow users to temporarily mute specific alerts or groups of alerts. This is useful during planned maintenance or known periods of increased alerting activity.
“`yaml
silence:
– matchers:
– name: “severity”
value: “critical”
creator_id: “user123”
“`
This example defines a silence rule that mutes alerts with a severity level of “critical” and associates it with a specific user (`user123`).
Notification Templates:
Notification templates define the content and format of alert notifications. They can include information such as summary, description, and other details. Templates are used to customize the appearance of notifications sent to external systems.
“`yaml
templates:
– ‘template/*.tmpl’
“`
This example specifies a directory containing notification templates. Templates can use placeholders to dynamically insert information from the alerts.
Web UI:
The Alertmanager provides a simple web-based user interface for monitoring the status of alerts, active silences, and alert history.
This basic Alertmanager configuration provides a foundation for managing alerts and notifications in a Prometheus monitoring setup. Users can customize these settings based on their specific requirements, adding more receivers, route configurations, and fine-tuning suppression and silence rules as needed.
Configuring Alerts:
Alertmanager configuration
A common configuration for Alertmanager in the context of Prometheus typically involves setting up receivers, routes, and global configurations. Below is a basic example of a common Alertmanager configuration file for use with Prometheus:
Alertmanager values:
“`yaml
global:
resolve_timeout: 5m
route:
group_by: [‘job’, ‘severity’]
group_wait: 30s
group_interval: 5m
repeat_interval: 12h
receiver: team-notifications
receivers:
– name: team-notifications
email_configs:
– to: team@example.com
inhibit_rules:
– source_match:
severity: ‘critical’
target_match:
severity: ‘warning’
equal: [‘alertname’, ‘instance’]
silence_timeout: 1h
“`
Explanation of key components:
Global Configuration:
The `global` section includes global settings for the Alertmanager instance. In this example, `resolve_timeout` is set to 5 minutes, specifying the maximum time to wait for an alert to resolve.
Route Configuration:
The `route` section defines how alerts are grouped and routed. In this example:
– `group_by`: Alerts are grouped by job and severity labels.
– `group_wait`: Time to wait before dispatching a group of alerts.
– `group_interval`: Interval at which to repeat dispatching a group of alerts.
– `repeat_interval`: Interval at which to repeat sending notifications for an unresolved alert.
– `receiver`: The default receiver for alerts.
Receiver Configuration:
The `receivers` section defines notification channels and their configurations. In this example, there’s a receiver named `team-notifications` configured to send email notifications to the specified email address.
Inhibit Rules:
The `inhibit_rules` section defines inhibition rules to suppress or silence alerts based on the presence of others. In this example, it inhibits critical alerts if there are corresponding warning alerts with the same `alertname` and `instance` label values.
Silence Timeout:
The `silence_timeout` specifies the default duration for which a silence is applied. In this example, it’s set to 1 hour.
This is a basic configuration, and you may need to adapt it based on your specific needs. For instance, you might want to add more receivers for different notification channels, customize email templates, or configure additional inhibit rules based on your alerting requirements. Always refer to the [official documentation](https://prometheus.io/docs/alerting/latest/configuration/) for the most up-to-date and detailed information on configuring Alertmanager.